
An org chart shows the hierarchical structure of a company. Usually, it is very detailed, showing the relationships between positions, reporting lines, etc.
Org charts are good for any company, but often it becomes a complex task with too much data to handle. Unless you have great experience in creating org charts, the process can become really hectic.
An easy way to avoid this is to use EdrawMind – a software specifically designed to create charts. It has a large template gallery to help you quickly add data and customize your org chart. There are also various tools and features you can use to create out-class org charts.
In the following guide, you’ll learn more about org charts and their key elements. We’ll also dive deeper into how to create organizational chart generally and by using EdrawMind.
Table of Contents
Key Elements of an Organizational Chart
An org chart is the key to visualize a company’s structure and how its different parts fit together. But that is just one feature of an org chart; there are various other elements that comprise it. Let’s quickly delve into the key elements that make up an organizational chart.
1. Hierarchical Structure Showing Relationships Between Positions
An org chart has a hierarchy. It starts from the topmost position of the company and goes all the way down till the end of the chain of command. In most cases, the highest position, often the CEO or President, is at the top. As the chart moves, it displays different levels of management, departments, and teams.
All the employees are connected by lines that represent relationships between each position. Thus, such a structure shows who supervises whom.
2. Depicts Roles, Responsibilities, and Reporting Relationships
An org chart connects different roles, responsibilities, and reporting relationships within the company. One glance at the chart and you can tell how many employees are part of which project and who supervises them.
By outlining such connections, the chart shows who holds authority over specific roles. So, anyone can see the person responsible for a task and who to approach for guidance.
3. Shows Division of Labor and Span of Control
The division of labor means how tasks and responsibilities are distributed between employees. An org chart visually represents this division to simplify who handles which tasks in the company. Such division of labor also helps employees understand their responsibilities.
Besides, the chart shows the span of control. This way, anyone can know the person supervising projects and handling employees.
4. Identifies Management Levels and Leadership Hierarchy
The clear mention of supervision in an org chart shows the different management levels present in the company. You can see the hierarchy of leadership from top-level CEO to mid-level managers and more. This hierarchy goes all the way down to the bottom-most positions and clearly shows a company’s structure.
How to Create Organizational Chart?
Creating an org chart helps visualizing the structure of a company. Let’s learn some steps to guide you through the process of creating an org chart in general.
1. Gather Information
The first step is to collect all the necessary information you want to include in your org chart. Learn about the positions, roles, and reporting relationships of your company. Make a list of all the job titles, names of employees, and their respective supervisors. Know who reports to whom and on-going projects in the company.
2. Choose a Format for Your Org Chart
Decide on the format of your organizational chart, such as hierarchical charts, matrix charts, or flat organizational charts. Here is a quick table to help you understand the basic differences between each type:
| Hierarchical Organizational Chart | Matrix Organizational Chart | Flat Organizational Chart | Divisional Organizational Chart |
| Traditional and most widely used formatRepresents a clear chain of command from top to bottom (like a hierarchy)Easily shows who reports to whom within the organization | Shows a combination of functional and project-based structuresUses both vertical and horizontal reporting relationshipsUseful for organizations with multiple projects or products | Has a minimalistic structure with fewer levels of hierarchyMost suitable for startups or small businessesUses a decentralized structure | Organizes the company by divisions or business unitsEach division acts like a separate entity with its own functionsMost ideal for larger companies with multiple operations |
3. Connect Positions and Add Names and Titles
Start by placing the highest authority figure at the top of the chart (the CEO, President, or Director of the company). Then, add anyone who reports directly to the boss, like a manager (or multiple managers). Move further downwards and use boxes or shapes to represent each position and connect them with lines to show reporting relationships. Lastly, fill in the job titles and names of employees in each box or shape.
How to Create Organizational Chart in EdrawMind?
Creating an organizational chart is complex when dealing with multiple departments, teams, and positions. However, with the help of a software like EdrawMind, the process becomes fairly simple. Here are some key steps to creating amazing org charts in EdrawMind.
1. Decide: EdrawMind Software or EdrawMind Online
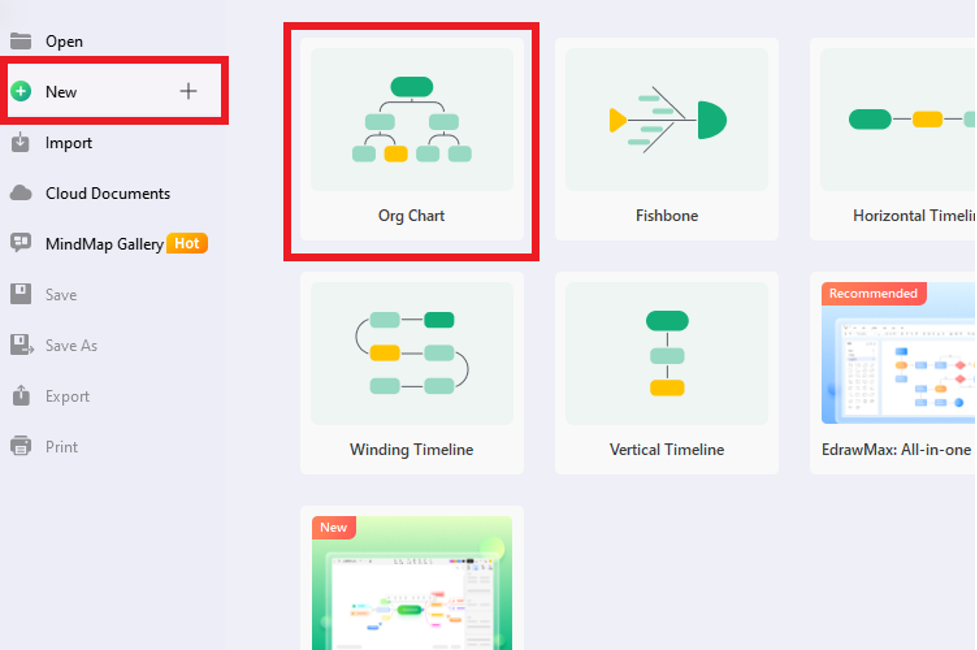
In simple words, EdrawMind provides two options for creating org charts. One is using the EdrawMind Software on your computer. The other includes using EdrawMind online. Once you have decided, open the software/app online and go to the New option in the left sidebar. From there, select any template to open it.
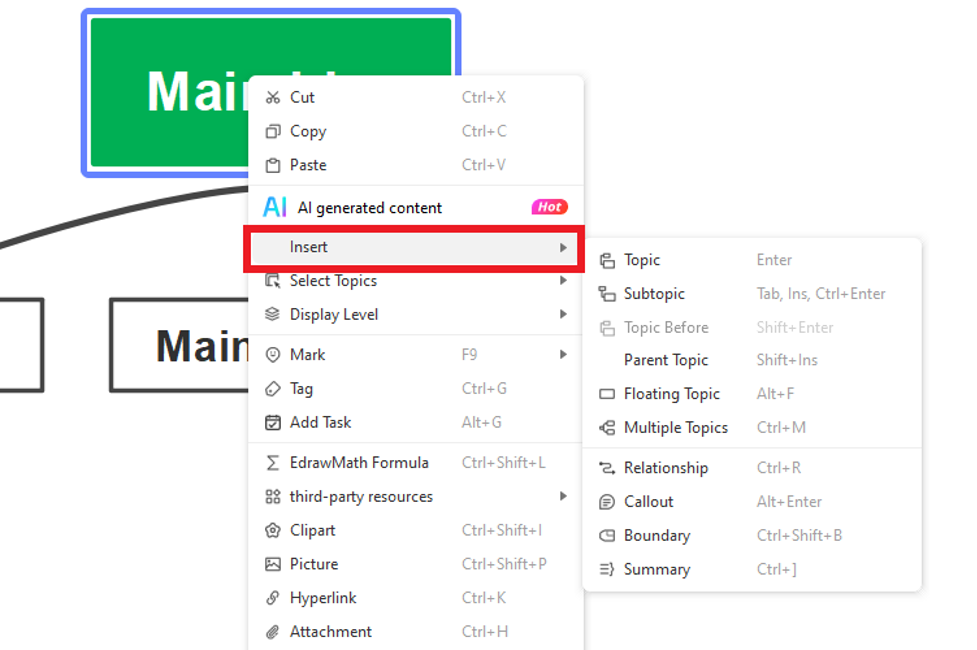
2. Customize Your EdrawMind template
You can customize the template by adding various shapes, roles, and other elements. Make sure it accurately represents the structure of your organization. EdrawMind also offers an easy drag-and-drop feature. So, you can quickly add and position elements in your org chart.
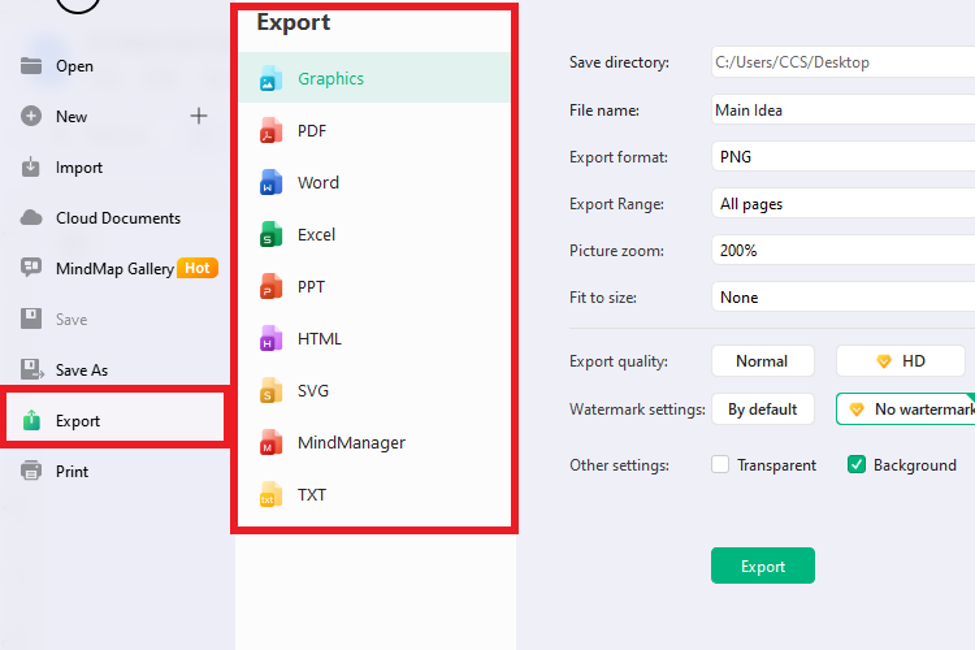
3. Save and Export Your Chart
Lastly, save your chart to your device. EdrawMind has a range of formats to choose from, that include
- Graphics
- Word
- Excel
- PPT
- HTML
- SVG
- TXT, etc.
Conclusion
In a nutshell, org charts are great tools to visualize the structure of your company. The process becomes even more efficient when using EdrawMind. Just select any template, customize it to your preference, and export the chart to your device. By following these three simple steps, you can create well-detailed org charts effectively.